imkoy
back to the index
Water Quality Simulations
Initial note: The presented values are for demonstration purposes and do not necessarily align with reality.Simulations of river water quality rely on mathematical equations to estimate the behavior of contaminants in the aquatic environment. These contaminants may be chemical, biological, or metallic and each type relies on various variables to estimate their concentrations along the river, as they interact differently with the various physical and chemical parameters of the waterbody.
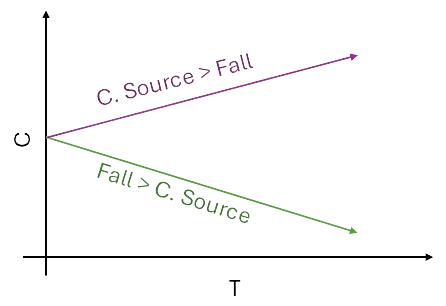
In general, every conservation and sustainability project aims to maintain or reduce the concentration of contaminants in a river. As shown in the figure below, we aim for the contaminant source (or load) to be lower than the river capacity to dilute or degrade it, so that the concentration remains below the regulatory threshold, thereby reducing harm to public health and the environment.
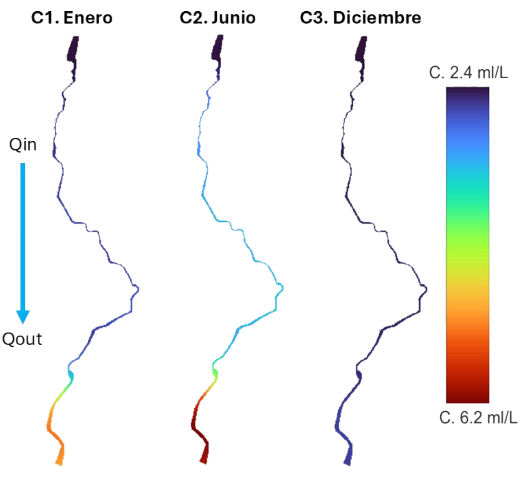
For demonstration purposes, the contaminant dispersion model presented illustrates three contaminant discharges occurring in different sections of the river over three months of the year: 1. February, 2. May, 3. September.
This example presents a river through the year but presented in three different months on each column. The color scale represents contaminant concentrations where red is high or above the norm and blue is a non-problematic concentration.
Contaminant dispersion models can be highly complex as there are multiple biological, chemical, and fisical values that may be considered; they are highly valuable to land planners and project managers, providing a scientific foundation as well as a way to predict contaminant behaviour.
The below example presents three types of contaminant concentration Biological Oxigen Demand (DBO), Dissolved Oxigen (OD), and Nitrates (NO3) showcasing their concentration based on an international threshold.
Post date: 2024-12-23
Last edit: 2024-12-23